Workshop - Microbiome bioinformatic analysis
| Lesson | Link |
|---|---|
| Set up and resources | link |
| Sequence processing | link |
| Data cleaning | link |
| Data visualization | link |
About the data
Today we will be using amplicon 16S rRNA data from West et al. (2020) Gut 69, 1452-1459. doi: 10.1136/gutjnl-2019-319620. The Rdata we will use is available from GitHub repository by the author link here. For this workshop the relevant .Rdata for today’s session has been made available within this repository.
Methods
Exert direct from West et al. 2020
Stool samples were randomised for processing and DNA was extracted (see online supplementary methods) using the PowerLyzer PowerSoil DNA Isolation Kit (Mo Bio). 16S rRNA gene amplicon sequencing targeting the V1-V2 regions was performed on the Illumina MiSeq platform as previously described21 Raw reads were processed in the R software environment19 following a published workflow22 which includes amplicon denoising implemented in ‘DADA2’23. See (online supplementary methods) for full details. Functions in the ‘vegan’ R package were used to calculate Shannon Diversity Indices (\(\alpha\)-diversity) on data rarefied to the minimum sequencing depth and Bray-Curtis dissimilarity (\(\beta\)-diversity) on log-transformed data (pseudocount of 1 added to each value). Significance of group separation in \(\beta\)-diversity was assessed by permutational multivariate analysis of variance. Changes in relative abundance were tested at each taxonomic rank from phylum to genus using the Mann-Whitney U test while differentially abundant 16S rRNA gene sequences were identified using ‘DESeq2’24. For ‘DESeq2’ analysis, data were pooled for each individual rather than analysing distinct time points.
Extra reference for microbiome sequencing
Mullish BH , Pechlivanis A , Barker GF , et al. Functional microbiomics evaluation of gut microbiota-bile acid metabolism interactions in health and disease. Methods 2018;149:49–58. doi: 10.1016/j.ymeth.2018.04.028
Introduction
Microbiome, metagenomics and bioinformatics is a huge area of study so we certainly wont be covering all aspects of it here.
- Estimated that there are 1014 microorganisms inhabiting the human gut.
- Human gut microbiome genome size 150 x larger than the human genome.
- Interactions between the microbe-host are of key interest in several pathologies and applying meta-omics to describe the human gut microbiome will give a better understanding of this crucial crosstalk at mucosal interfaces.
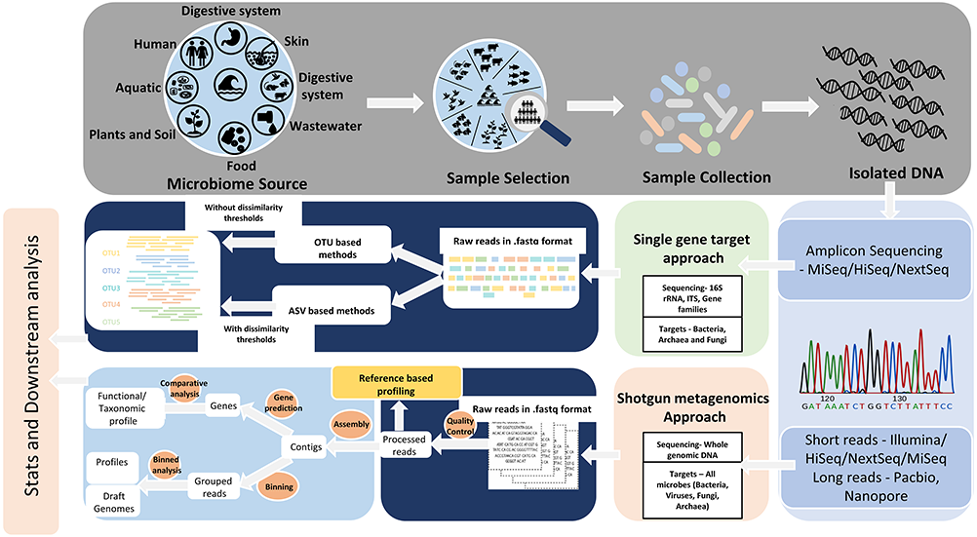
Today there are two main molecular approaches that we use for microbiome studies
1. Metagenomics = DNA
- Genomic characterisation of bacteria.
- Identify what bacteria is present in sample.
- Two main methods:
- A. Amplicon 16S rRNA sequencing.
- Sequence the 16S rRNA gene (targeting bacteria only).
- Use primers targeting the 16S gene - hypervariable regions (V1-9).
- There are bias/differences between primers and regions.
- Ref: Bukin, Y., Galachyants, Y., Morozov, I. et al. The effect of 16S rRNA region choice on bacterial community metabarcoding results. Sci Data 6, 190007 (2019). doi: 10.1038/sdata.2019.7
- Most recent advances in “long-read” platforms (e.g. PacBio, nanopore) allow for full length 16S rRNA gene sequences.
- Currently not widely used but this will quickly change as technology becomes more widely available.
- Ref: Johnson, J.S., Spakowicz, D.J., Hong, BY. et al. Evaluation of 16S rRNA gene sequencing for species and strain-level microbiome analysis. Nat Commun 10, 5029 (2019). doi: 10.1038/s41467-019-13036-1
- B. Shotgun/whole genome sequencing.
- Sequence all the genomic material within the sample.
- This will include the host (e.g. human) DNA as well so need much deeper level of sequencing.
- Able to sequence viral communities - extract RNA and convert to cDNA.
- A. Amplicon 16S rRNA sequencing.
2. Metatranscriptomics = messenger RNA - Gene expression and regulation - Used for functional potential - Better for relative abundance comparison - no PCR bias
Pros of amplicon NGS
Cheaper
Less data intensive
Easier to make sense of…e.g. good reference databases available.
More sensitive at detecting lower abundant bacteria (shot gun sequencing = mainly host DNA)
Terminology note
- You may see reference to difference sequencing platforms when you read so just to clarify. Next-generation sequencing = high throughput sequencing. Although now terminology has moved to “short-read” vs “long-read” sequencing. But when reading most articles next-generation sequencing usually equals short read sequencing.
- Short read platforms
- 454 - pyrosequencing
- Ion Torrent - semiconductor sequencing
- Illumina - clusters on flow cell (most common) - Machines: iSeq NextSeq (300 bp), MiniSeq NextSeq (300 bp), MiSeq (max 600 bp), NextSeq (300 bp), Nova Seq (500 bp)
- Long read platforms - technologies still developing to improve accuracy
- PacBio
- Nanopore
Bioinformatics
We will only briefly go through these steps to give you an idea of what is involved. There are various programs and databases required for these steps - so you won’t be performing all of these on your machines today.
Instead I’ll go through the main steps and give you access to some scripts. Then I’ll share with you the output files that we will use for the data visualization part.
There is a wealth of information and different pipelines available but generally most use very similar algorithms under the hood.
The most widely used pipelines include:
Note that the list above is not mutually exclusive. For example the popular QIIME2 uses dada2 or vsearch or clustering/denoising.
Main steps of processing 16S amplicon sequencing
Optional first step - depending on sequence platform if you have forward and reverse reads you will first need to merge these. Most pipelines have built in merge function so you can avoid using a separate program. This step is fairly straight forward and not much difference between programs. PEAR is a popular stand alone program.
Demulitplex.
Use of barcodes (i.e. sequence of 6-8 nucleotides added to primers to identify individual samples).
Depending on library prep used and sequencing platform this might be automated.
E.g. Illumina and Nextera indexes are automatically demultiplexed on sequencing machine.
Trim primers and distal bases - this will also depend on QC (quality) scores.
- Lots of options available, again I try and keep number of programs etc to a minimum. Most pipelines will have some sort of trimming/QC function built in.
- FASTQC is popular for viewing sequence files and automating QC reports.
Cluster or denoise
Group related sequences.
Traditional approaches relied on clustering.
Grouped sequences that were within 97% similar i.e group sequences at the species level.
Common tools = vsearch (use stand alone or within QIIME2 pipeline) and uparse (used within USEARCH pipeline).
Newer approaches use denoising method.
More accurate method to correct sequencing errors and determine real biological sequences at single nucleotide resolution by generating amplicon sequence variants (ASVs).
Common tools = dada2 (use stand alone or within QIIME2 pipeline) and unoise3 (used within USEARCH pipeline).
Terminology: The data produced from the clustering/denoising step is referred to a either “Operational Taxonomic Units (OTUs)” or “Amplicon Sequence Variants (ASVs)”. Unfortunately terminology in genomics is not always consistent. But as a general rule of thumb OTUs refer to data produced via clustering and ASVs refers to data produced by denoising (however unoise3 in USEARCH refers to these as Zero-radius taxonomic units (ZOTUs) in this case ZOTU = ASV).
Assign taxonomy
Algorithms on taxonomic assignment and classification level (e.g. Genus, Family etc). Rarely obtain accurate species level assignment with 16S amplicon but depends on the amplicon region, size, taxa group and region of 16S gene.
q2-feature-classifier - used in QIIME2 pipeline (one of the best options currently available).
SINTAX - used within USEARCH pipeline.
Curated databases with representative of taxa. Comparison of main databases - SILVA, RDP, Greengenes, NCBI and OTT how do these taxonomies compare? Balvociute and Huson (2017) BMC Genomics, 18(2), 114. doi: 10.1186/s12864-017-3501-4.
Data cleaning and visualization
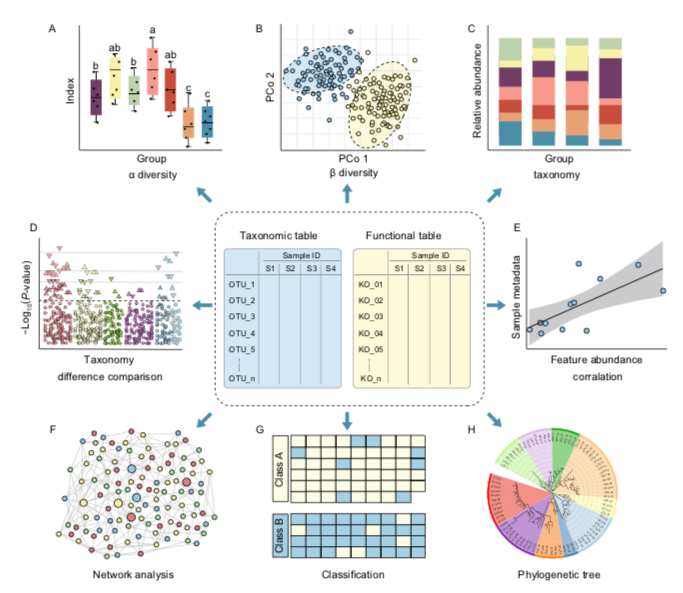
There are a number of different analysis and visualization options that you can use depending on your data and questions.
Some common examples include:
- Rarefaction curves
- Alpha diversity plots
- Taxonomy barplots/heatmaps
- Beta diversity and ordination
- Network analysis
- Correlation
- Phylogenetic
In this part of the workshop we will go through some different ways you can visualize the data and some statistical analysis. We will do this in RStudio. Just like the bioinformatic sites above there is a wealth of options for this. My personal preference is RStudio as it is easily reproducible (VERY important for bioinformatics) and is easy to upscale. In addition with the ever increasing data being produced RStudio provides the best platform to integrate different data types and create custom pipelines.
Working within RStudio environment is not limited to just running code locally on your machine. RShiny allows you to make custom apps and web interface programs..
Further detail on cleaning data after processing sequences is covered here
Useful links for microbial genomics analysis
Mainly aimed at amplicon sequence methods
- Happy Belly Bioinformatics - A useful website containing information, tutorials and links related to bioinformatics (written by a biologist turned bioinformatician!)
- mixOmics - Our mixOmics R package proposes a whole range of multivariate methods that we developed and validated on many biological studies to gain more insight into ‘omics biological studies. Useful GitBook here
- phyloseq - R package for the analysis of microbial communities brings many challenges. Integration of many different types of data with methods from ecology, genetics, phylogenetics, network analysis, visualization and testing
- Tools for Microbiome Analysis - A list of R environment based tools for microbiome data exploration, statistical analysis and visualization
- My own list of useful microbiome resources - this includes some links to RShiny packages which provide an interactive look at your data. However they require your data to be in a specific format.